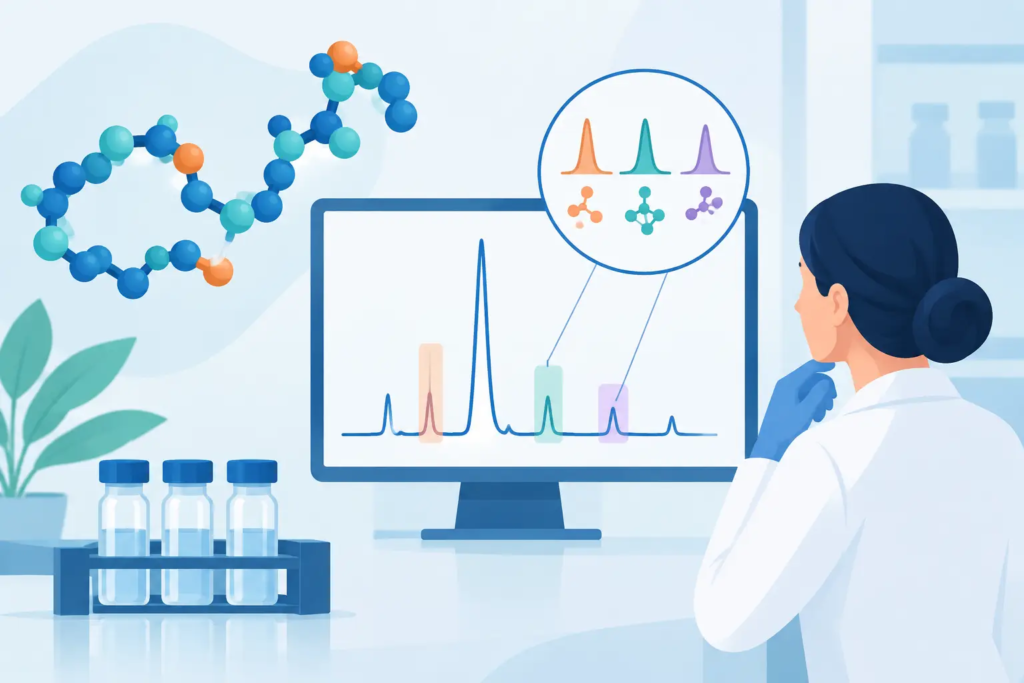
A chromatogram with a 99% main peak can look straightforward. It rarely tells the full analytical story on its own. Peptide impurity profile interpretation is the process of determining what the remaining signal may represent, how confidently it can be assigned, and whether the documented batch is suitable for a defined laboratory research workflow.
For research procurement, the objective is not simply to find the largest purity percentage. It is to establish a defensible chain of evidence: the material matches the intended identity, the reported purity method is clear, the impurity pattern is credible, and the documentation corresponds to the actual batch received. This is especially relevant when experimental results require repeatability across orders or when a laboratory must maintain organized procurement records.
What an Impurity Profile Actually Shows
An impurity profile is the analytical picture of components detected alongside the intended peptide. It is commonly generated by high-performance liquid chromatography, or HPLC, with supporting identity confirmation by mass spectrometry. The principal peak is generally assigned to the target peptide, while smaller peaks may indicate process-related substances, peptide-related variants, degradation products, residual materials, or analytical artifacts.
A reported purity value is usually based on the relative area of the main peak under specified chromatographic conditions. If a certificate states greater than 99% HPLC purity, the target peak accounts for more than 99% of the integrated UV signal under that method. That is meaningful quality information, but it is not the same as a complete structural identification of every minor peak.
This distinction matters because UV area percentage depends on detector wavelength, method conditions, and the UV response of each component. A trace-level component with a different chromophore or weak absorbance may not produce an area directly proportional to its mass fraction. Researchers should treat HPLC purity as a method-specific measurement, then consider it alongside mass spectrometry, batch documentation, and the intended sensitivity of the experiment.
Peptide Impurity Profile Interpretation Starts With the Method
Before assigning significance to a minor peak, review how the analysis was performed. A useful Certificate of Analysis should identify the batch or lot, the product name, the purity result, the analytical method, and the test date or report date. For peptide materials, HPLC and MS work together for different reasons: HPLC separates detectable components, while MS supports molecular-mass confirmation of the intended analyte.
Chromatographic method details affect what can be seen. Column chemistry, mobile-phase composition, gradient length, flow rate, sample solvent, injection load, and UV detection wavelength can alter peak shape and retention. A short gradient may be appropriate for routine release testing but may not resolve closely related peptide variants as effectively as a longer, more selective method. A clean chromatogram is useful only in the context of a method capable of separating the impurities of concern.
Mass spectrometry also has boundaries. Observing the expected molecular mass supports identity, but it does not prove that no isobaric or near-isobaric sequence variant is present. More detailed characterization may require additional analytical approaches, depending on the peptide, study design, and level of risk associated with the work.
Common Sources of Peptide Impurities
Most peptide impurity profiles reflect the chemistry and handling history of the material, not a single generic failure mode. Solid-phase peptide synthesis can produce deletion sequences, incomplete deprotection products, truncated sequences, or modified residues. Cleavage and purification may introduce additional byproducts, particularly for longer sequences or peptides with chemically sensitive amino acids.
Oxidation, deamidation, hydrolysis, aggregation, and disulfide-related variants can emerge during storage or preparation. Their likelihood depends on the peptide sequence, packaging, exposure to moisture, temperature history, light exposure, and reconstitution conditions. A profile generated at release therefore documents the lot at the time of testing. It does not replace appropriate storage controls after receipt.
Some signals are not peptide-related at all. Residual solvents, salts, counterions, or trace processing reagents may require separate methods because a standard UV-HPLC impurity profile is not designed to quantify every possible non-peptide component. This is why researchers should avoid reading a single purity percentage as a universal statement about all chemical attributes of a sample.
How to Read a Chromatogram Without Overstating It
Start with the main peak. Its retention time, symmetry, and integration should be consistent with the stated target under the reported method. A sharp, well-resolved principal peak with small, separated minor peaks is generally easier to assess than a broad peak, pronounced tailing, or an unresolved shoulder.
A shoulder beside the main peak deserves attention because it can indicate a closely eluting related substance that may not be fully resolved. Likewise, a broad baseline or multiple low-level signals across the chromatogram can suggest a more complex mixture, though sample solvent mismatch, excessive injection concentration, or instrument conditions may also contribute. Chromatographic appearance alone is evidence, not final identification.
Peak area is also not the only decision factor. A 0.5% impurity may be operationally insignificant for one screening assay yet unacceptable for another application involving highly sensitive analytical readouts. The appropriate acceptance threshold depends on the research objective, detection sensitivity, reference-material requirements, and whether comparison across batches is necessary.
When comparing lots, use comparable documentation and methods. A purity result from one HPLC method cannot be treated as directly equivalent to a result from a substantially different method. Consistency of test conditions makes trend assessment more meaningful.
A Practical Review of the COA
For routine laboratory purchasing, the most efficient review is a document-to-material check rather than an attempt to independently identify every small peak. Confirm that the product name, batch number, stated net quantity, and reported test results align with the item received and the supplier's records.
Then examine whether the documentation supports the decisions your laboratory needs to make. At minimum, researchers should be able to confirm the following:
- The COA is tied to a specific, identifiable batch.
- HPLC purity is reported with a defined result, not a general quality claim.
- MS data or a stated mass result supports the expected peptide identity.
- The report identifies the testing approach and relevant analytical conditions.
- Storage and research-use handling requirements are clear.
For higher-risk or highly sensitive research, request clarity before beginning work. Useful questions include whether the chromatogram is from the finished lot, whether the displayed spectrum corresponds to that lot, and whether the assay method is suitable for resolving expected sequence-related variants. The answer may determine whether a material is appropriate for a particular protocol.
Purity, Identity, and Fitness for Purpose Are Different Questions
A quality review is strongest when it separates three related but distinct questions. Identity asks whether the material is the intended peptide. Purity asks how much of the measured chromatographic signal is attributed to that peptide. Fitness for purpose asks whether the documented material is suitable for a specific research method.
A peptide can meet a high HPLC purity standard and still require different handling for a moisture-sensitive experiment. Conversely, a minor impurity may have no practical effect in an early-stage in-vitro screen but become relevant in method-development work. The correct interpretation is therefore tied to the experiment, not just the number printed on the report.
At SKO Compounds, product-specific documentation, HPLC testing, mass spectrometry verification, and impurity profiling are intended to provide researchers with a clear basis for batch review. Materials are sold strictly for laboratory research use only and are not intended for human or veterinary use, diagnosis, treatment, injection, ingestion, or consumption.
Preserve the Meaning of the Original Profile
Once a batch is received, storage and preparation can change its analytical condition. Keep lyophilized peptide material stored according to the product guidance, minimize unnecessary exposure to heat and moisture, and document reconstitution conditions in the laboratory record. If a study requires extended use after reconstitution, a stability assessment under the actual conditions may be more informative than relying only on the release chromatogram.
The most useful impurity profile is not the one with the most impressive isolated number. It is the one supported by a traceable batch record, an appropriate analytical method, and a careful match between the material's documented attributes and the work your laboratory plans to perform.